As mentioned in Part 2, Amazon CloudWatch is a monitoring service to monitor your AWS resources, as well as the applications that you run on AWS.
Read more: Amazon CloudWatch Introduction (Part 1) | VTI CLOUD
Basically, it can monitor things like:
| Compute | Storage & Content Delivery |
|
+ Autoscaling Groups + Elastic Load Balancers + Route53 Health Checks |
+ EBS Volume + Storage Gateways + CloudFront |
| Database & Analytics | Others |
|
+ DynamoDB + Elasticache Nodes + RDS Instance + Redshift |
+ SNS Topics + SQS Queues + CloudWatch Logs + Estimated Charges on your AWS Bill |
Amazon CloudWatch Metrics
By default, CloudWatch monitors these metrics for your instance:
-
Instance metrics (CPU Utilization/Disk IOPS/Network In-Out…)
-
CPU credit metrics (CPUCreditUsage/Balance…)
-
Amazon EBS metrics for Nitro-based instances (EBS Read/Write IOPS)
-
Status check metrics
-
Traffic mirroring metrics
-
Amazon EC2 metric dimensions
-
Amazon EC2 usage metrics (ResourceCount)
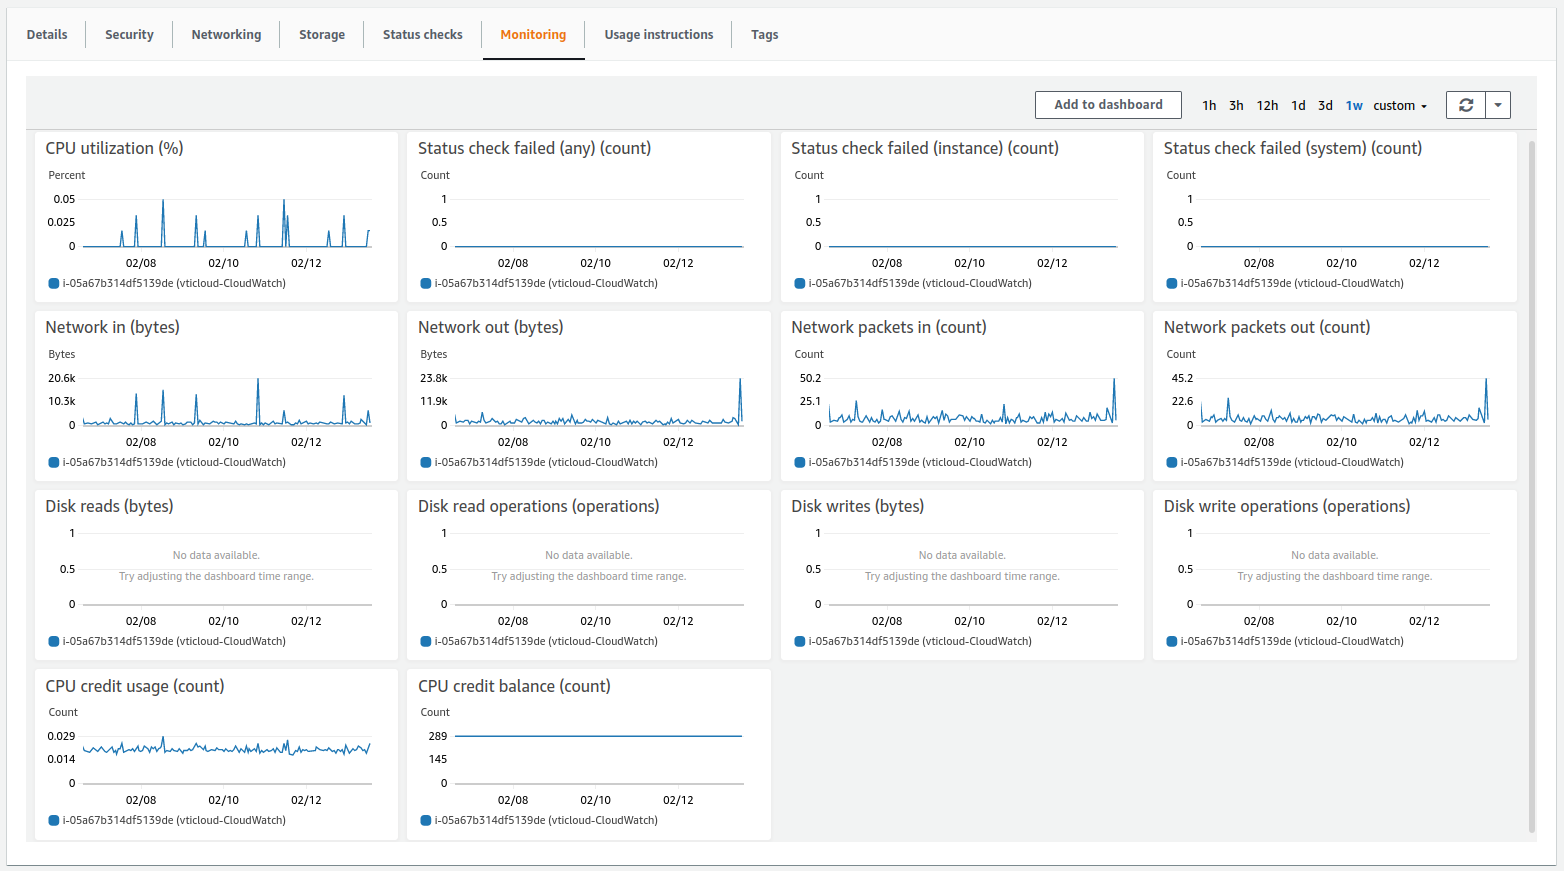
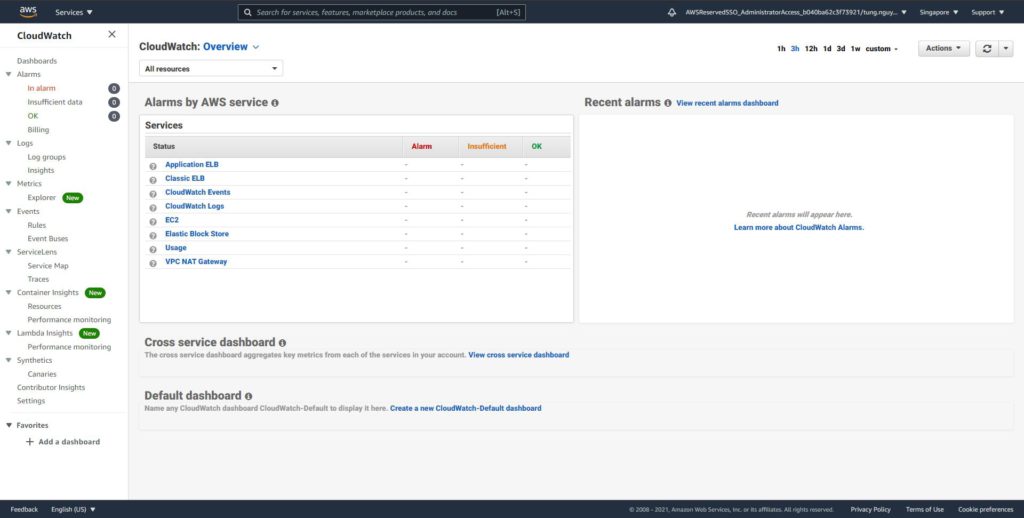
(Illustration for some metrics)
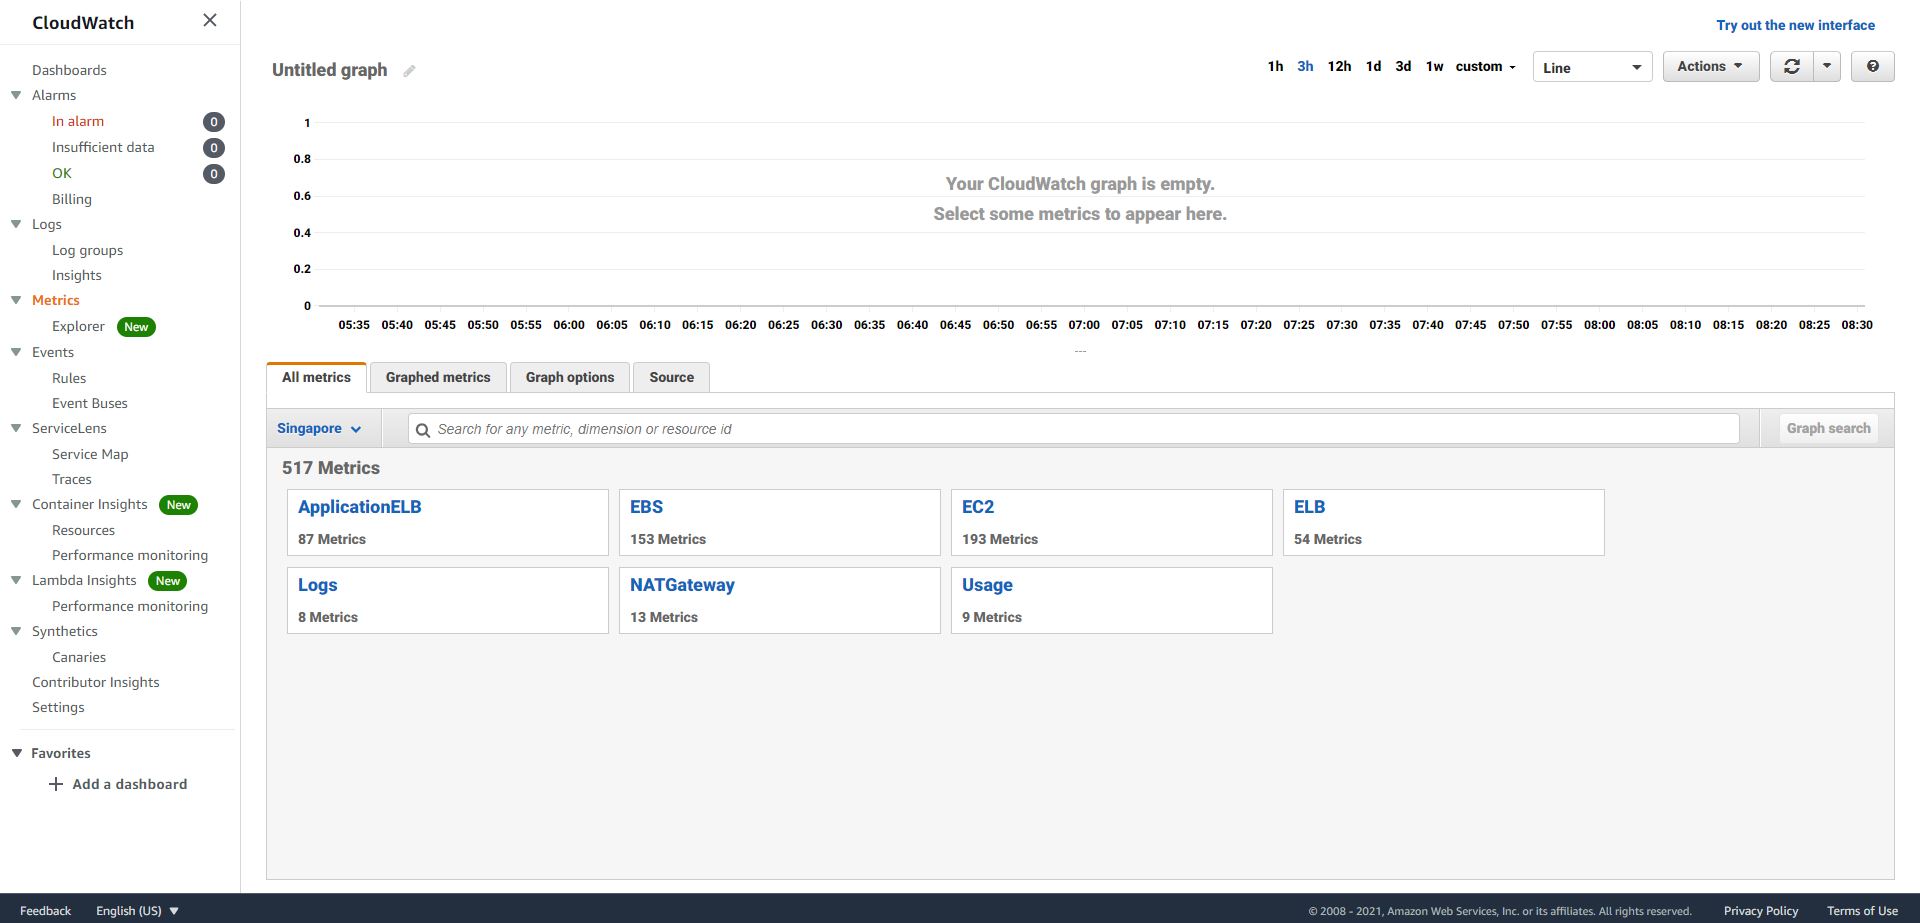
What it can’t monitor are things like: the storage space left or available, the RAM Utilization… or anything else that falls out of the default Metrics provided by Amazon CloudWatch, we called them Custom Metrics. Custome Metrics is defined and published to CloudWatch by the user.
Amazon CloudWatch Logs
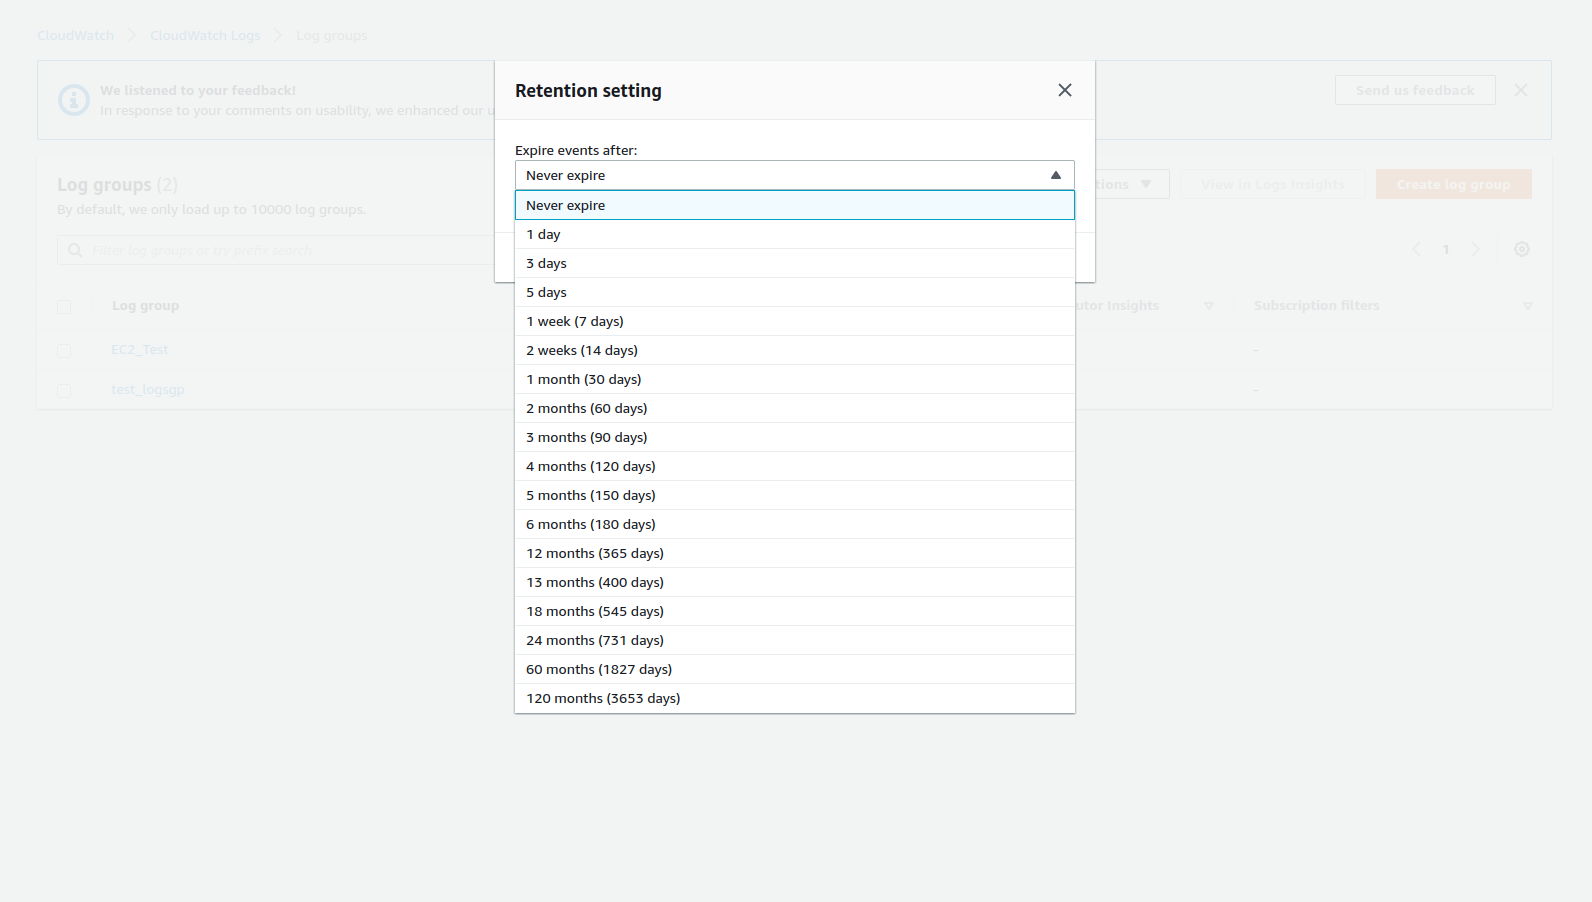
Also, it is important to understand that you can store your log data in CloudWatch Logs for as long as you want. By default, CloudWatch Logs will store your log data indefinitely, you can change the retention for each Log Group at any time, example: For EBS, you only want data for the last two weeks but all the back to six months for EC2 Instances.
One more thing to keep in mind is you can retrieve data from any terminated EC2 or ELB Instance or any AWS Services after its termination.
In terms of Metric granularity, it depends on what kind of metrics you are using. By default, it is 5-minute intervals for Default metrics and 1-minute intervals for Custom metrics.
You will get Basic monitoring and Detailed monitoring for Default Metrics.
Basic monitoring is every 5 minutes, Detailed monitoring is every 1 minute.
To enable detailed monitoring for an existing instance:
-
Open the Amazon EC2 console
-
In the navigation pane, choose Instances.
-
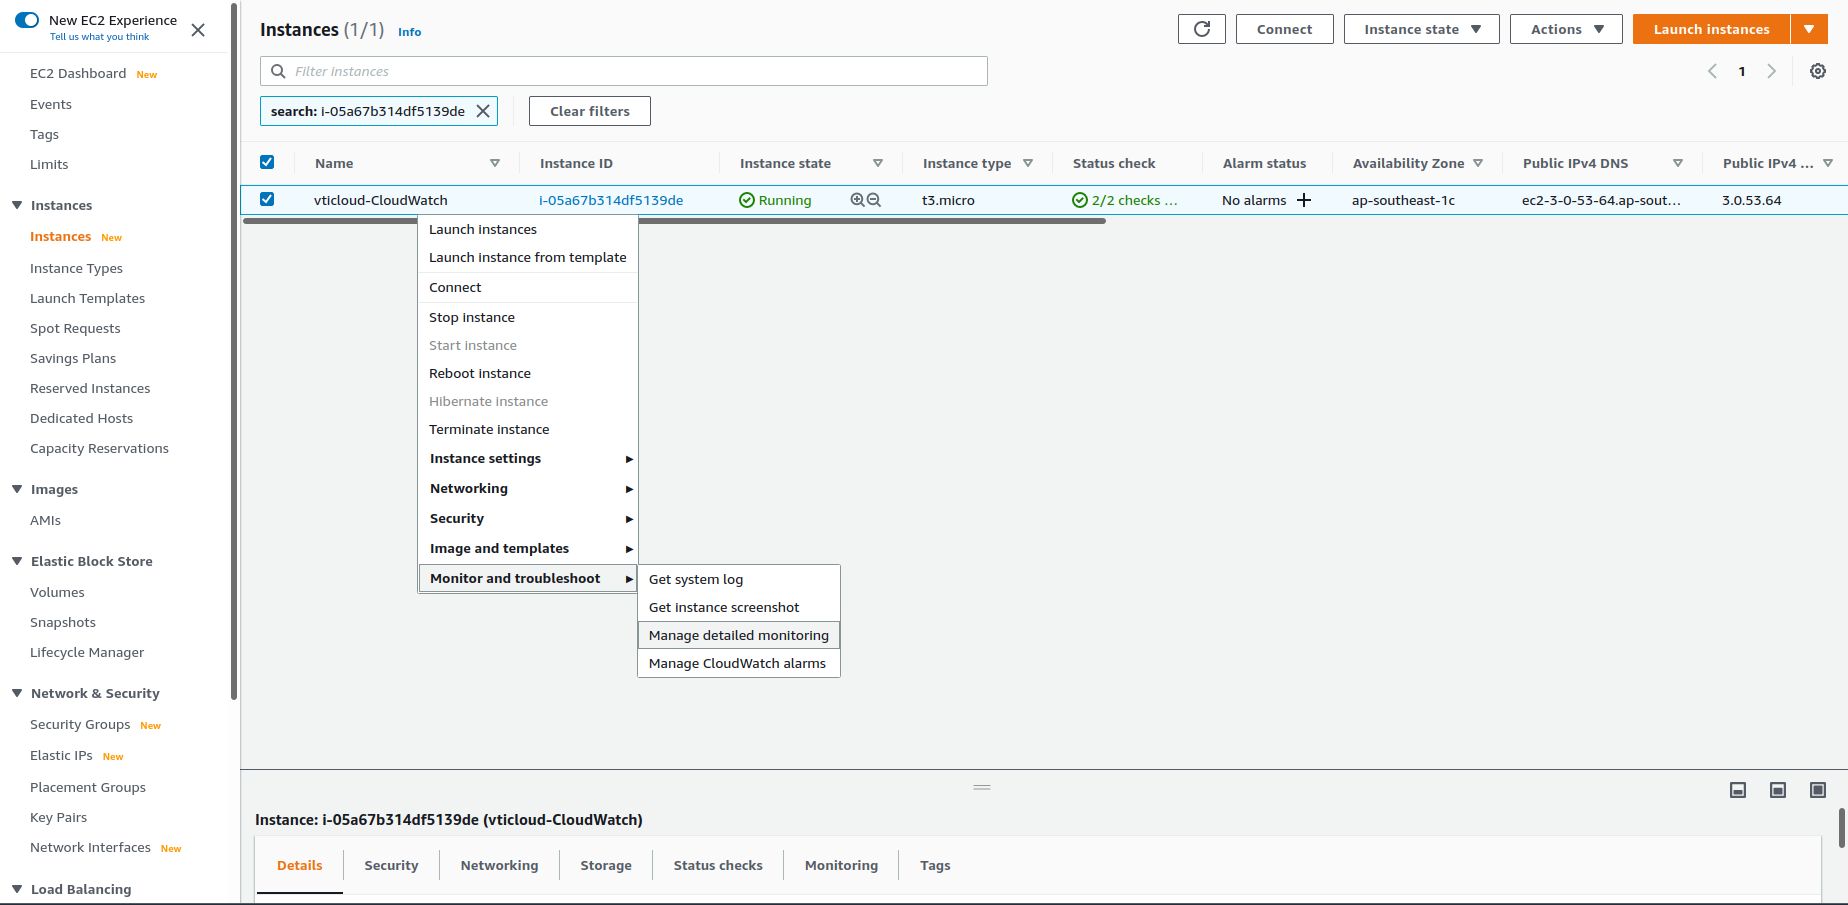
Select the instance, right-click and choose Monitor and Troubleshoot, Manage detailed monitoring.
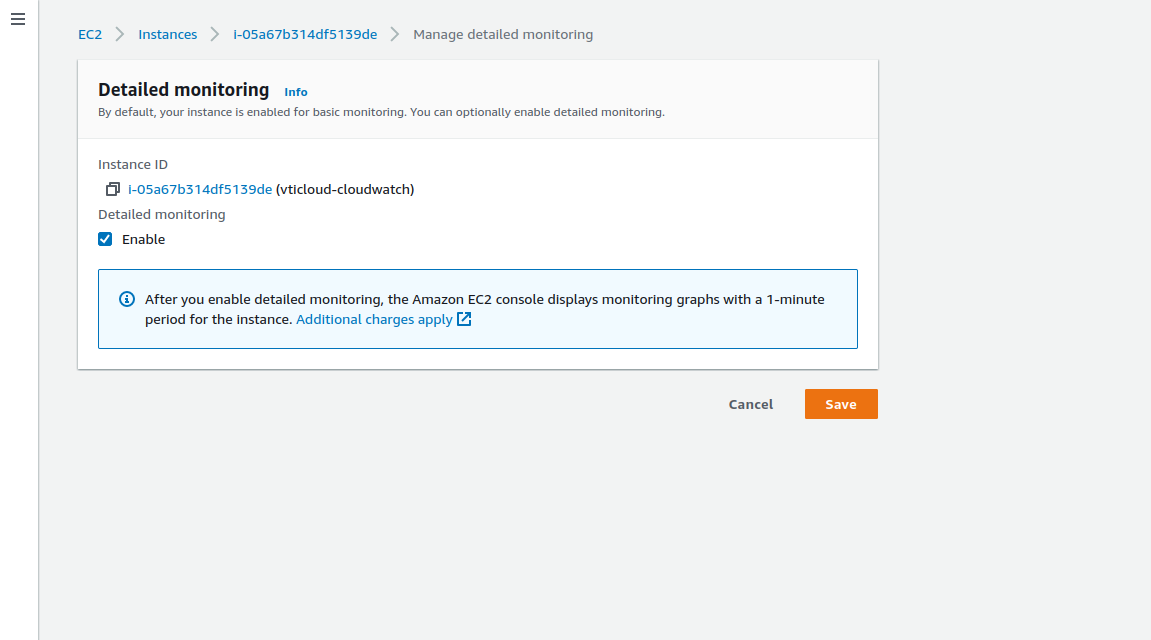
- On the Detailed monitoring detail page, for Detailed monitoring, select the Enable check box.
- Choose Save, and be aware of additional charges that may apply.
For Custom Metrics, you will have Standard and High-Resolution monitoring.
Amazon CloudWatch Alarms
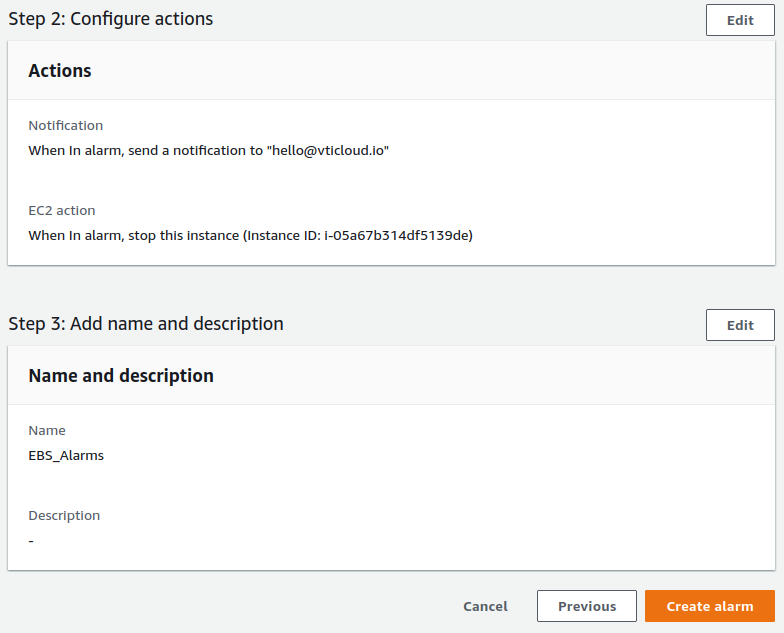
In terms of Alarms, you can create an alarm to monitor any Amazon CloudWatch metrics in your account including CPU Utilization, ELB Latency, etc. You can set the appropriate thresholds in which to triggers the alarms;
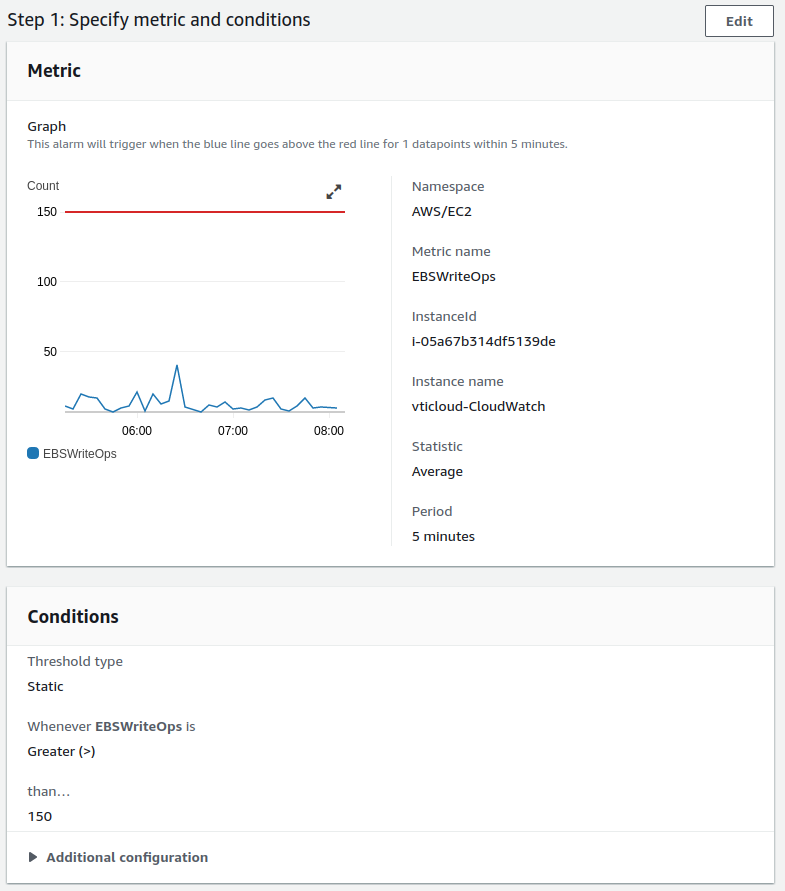
and also set what actions should be taken if an alarm state is reached. (tell it to send you an SNS notification or have it trigger a Lambda function and starts deleting your infrastructures).
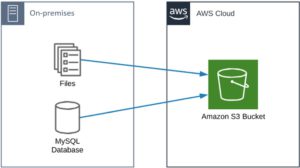
And one thing you should definitely be aware of is that CloudWatch can be used on-premise as well. It’s not restricted to just AWS resources. You can use this inside your own Data Center and have metrics being reported back to your CloudWatch Dashboard. The way to do this is you need to download and install the SSM agent, and then once that’s installed you need to download and install the CloudWatch agent follow this guideline.
About VTI Cloud
VTI Cloud is an Advanced Consulting Partner of AWS Vietnam with a team of over 50+ AWS certified solution engineers. With the desire to support customers in the journey of digital transformation and migration to the AWS cloud, VTI Cloud is proud to be a pioneer in consulting solutions, developing software, and deploying AWS infrastructure to customers in Vietnam and Japan.
Building safe, high-performance, flexible, and cost-effective architectures for customers is VTI Cloud’s leading mission in enterprise technology mission.
